Analytics & KPIs
Data that actually helps you run the shop
Stop flying blind. See real-time metrics on first-pass yield, average turnaround time, technician efficiency, and profitability across all your locations.

See it in action
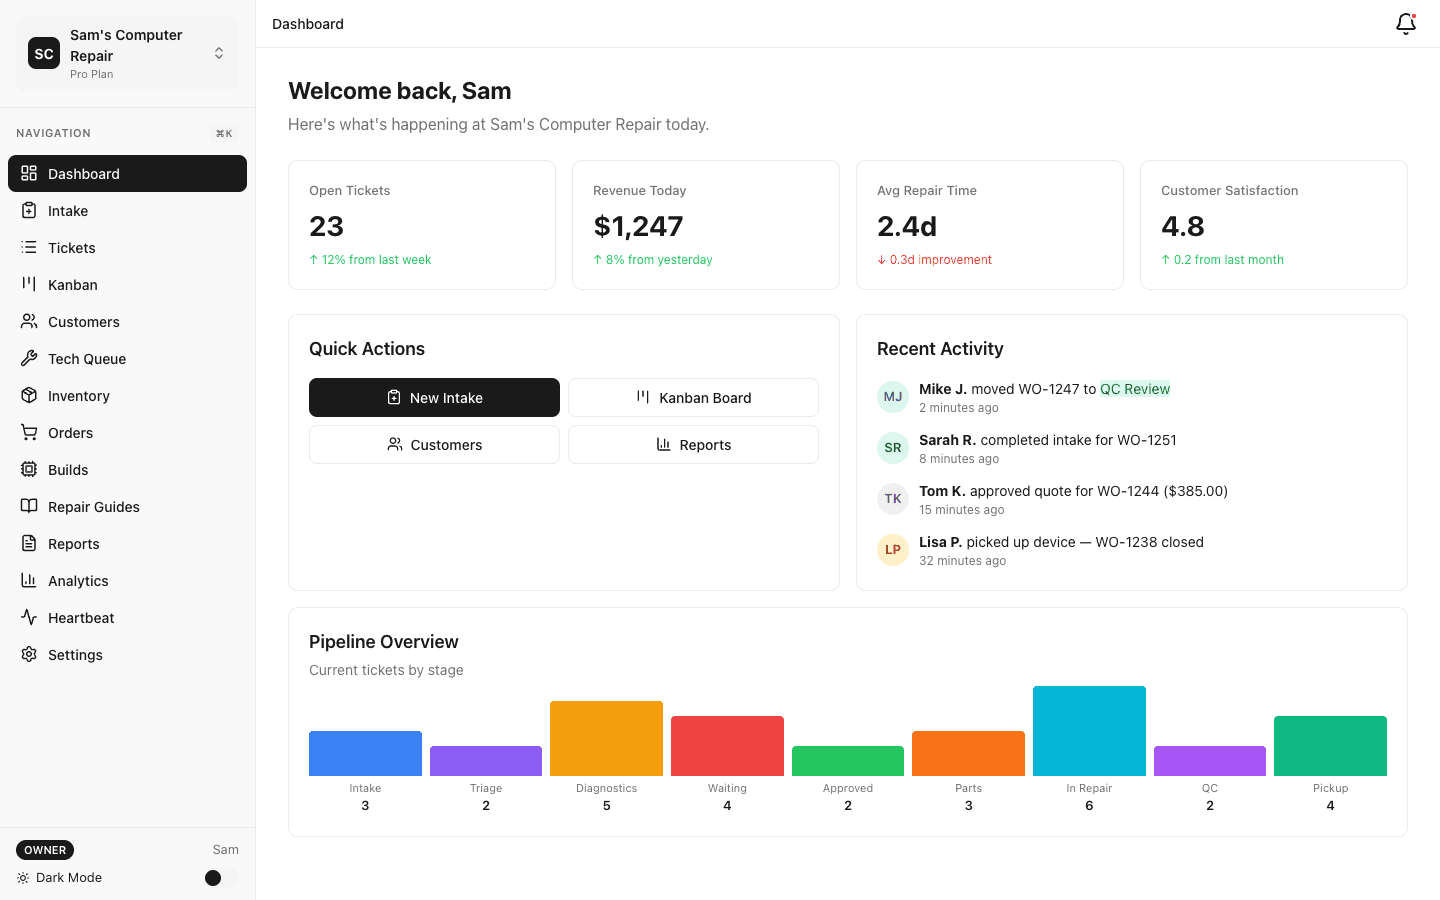
Shop dashboard with KPIs and revenue chart
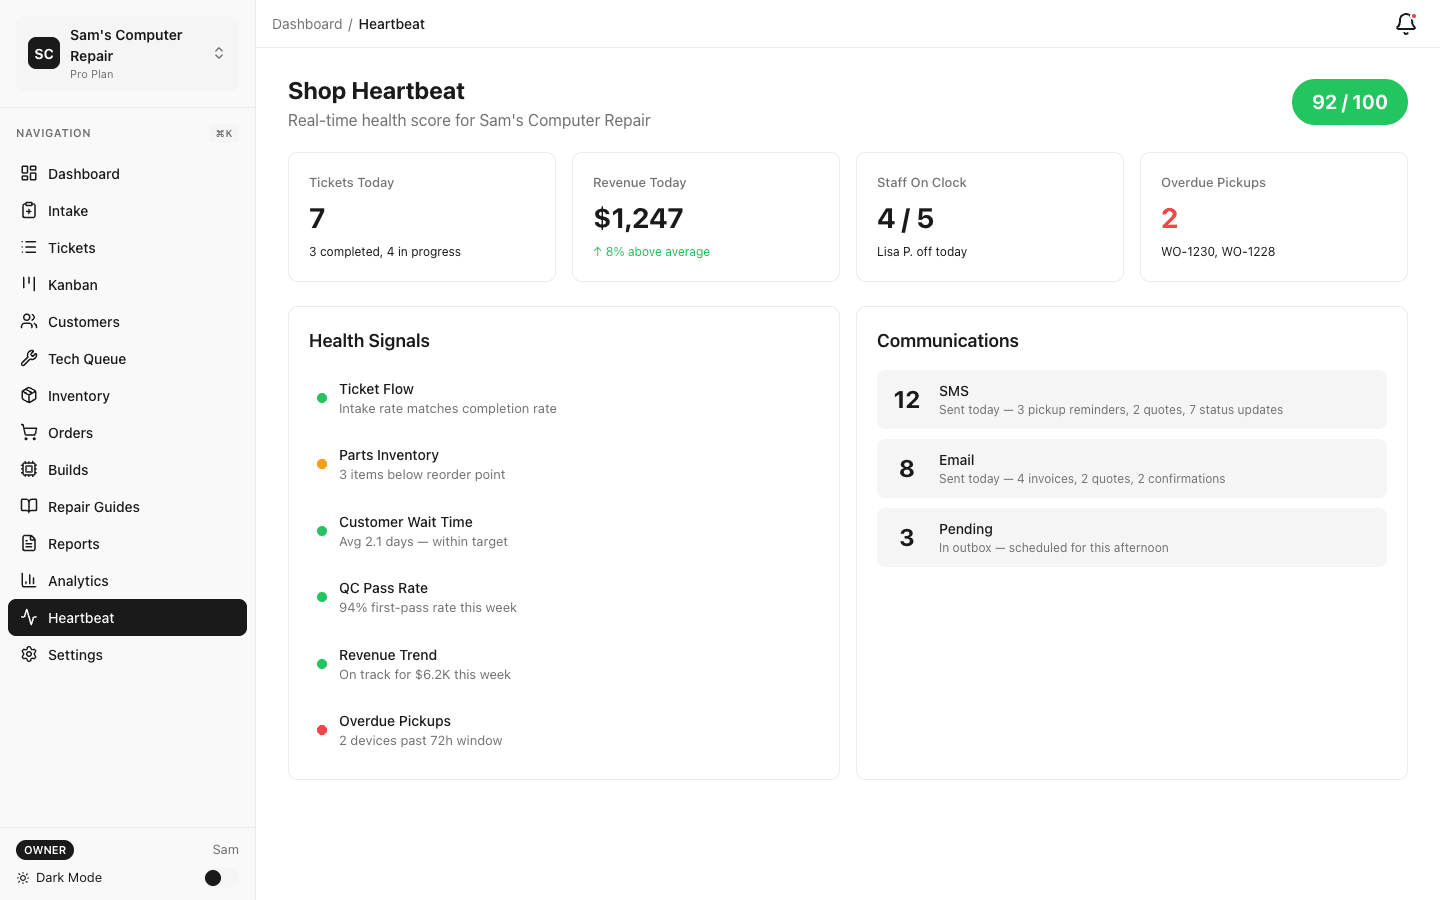
Shop heartbeat monitor with real-time metrics
Why you need it
Owner Dashboards
Get a high-level view of daily revenue, open ticket volume, and SLA breaches.
Tech Efficiency
Track individually billed hours vs clocked hours to identify training opportunities.
Export Anywhere
Export reports to CSV, PDF, or directly to an S3 bucket or API endpoint for custom business intelligence.
How it works
Collect Data Invisible
Every status change and time-clock punch is recorded securely in advance.
Visualize Real-time
The KPI dashboard updates live, requiring zero manual refreshes or nightly cron jobs.
AI Insights
The AI partner suggests improvements, like noticing iPhones are taking 20% longer this week.
Related to analytics & kpis
Learn more
From the blog


Solutions for your business
Try Analytics & KPIs free for 14 days
See how RepairOps can streamline your shop. No credit card required.